- English (UK)
- English (India)
- English (Canada)
- English (Australia)
- English (South Africa)
- English (Philippines)
- English (Nigeria)
- Deutsch
- Español (España)
- Español (México)
- Français
- Italiano
- Nederlands
- Polski
- Português (Portugal)
- Português (Brasil)
- Русский
- Türkçe
- العربية
- Ελληνικά
- Svenska
- Suomi
- עברית
- 日本語
- 한국어
- 简体中文
- 繁體中文
- Bahasa Indonesia
- Bahasa Melayu
- ไทย
- Tiếng Việt
- हिंदी

Chewy Inc (CHWY)
Chewy Inc stock price live, this page displays NYSE CHWY stock exchange data. View the CHWY premarket stock price ahead of the market session or assess the after hours quote. Monitor the latest movements within the Chewy Inc real time stock price chart below.
What Is the Chewy Inc Stock Price Today?
The Chewy Inc stock price today is 27.17.
What Is the Stock Symbol for Chewy Inc?
The stock ticker symbol for Chewy Inc is CHWY.
Is CHWY the Same as $CHWY?
$CHWY is a common way to refer to the Chewy Inc ticker symbol in social media, forums, and online discussions. The dollar sign is a shorthand convention used to indicate that it is a stock ticker symbol
What Stock Exchange Does Chewy Inc Trade On?
Chewy Inc is listed and trades on the NYSE stock exchange.
Is Chewy Inc a Good Stock to Buy?
Determining whether Chewy Inc—or any stock—is a good buy requires comprehensive analysis. To evaluate its potential, users can sign up to InvestingPro, where they can assess the current Chewy Inc share price compared with the fair value and other essential metrics.
You can find more details by visiting the additional pages to view historical data, charts, latest news, analysis or visit the forum to view opinions on the CHWY quote. (ISIN: US16679L1098)
Currency in USD
Fair Value
An estimate of a stock's true price based on valuation models like discounted cash flow, peer valuation multiples, and dividend discount models.
Day's Range
26.38
27.24
52 wk Range
22.74
48.62
CHWY is not included in our AI-picked strategies. See which stocks are.
Fair Value
An estimate of a stock's true price based on valuation models like discounted cash flow, peer valuation multiples, and dividend discount models.
Day's Range
26.3827.24
52 wk Range
22.7448.62
Key Statistics
Edit
Prev. Close
Open
Volume
Average Vol. (3m)
1-Year Change
Book Value / Share
Fair Value
Fair Value Upside
Market Cap
Shares Outstanding
Revenue
Net Income
EPS
EPS Growth Forecast
Next Earnings Date
N/A
(N/A)
Dividends Payment Streak
P/E Ratio
Return on Assets
Return on Equity
Gross Profit Margin
Price/Book
EBITDA
EV/EBITDA
Beta
CHWY Scorecard
Company’s Health
Assesses a company's financial position by analyzing its market value, financial ratios, industry benchmarks, and competitors.
UnlockFair Value
An estimate of a stock's true price based on valuation models like discounted cash flow, peer valuation multiples, and dividend discount models.
Unlock PriceTechnical Analysis
Strong Buy
Price Target
40.81
Upside
+50.20%
Members' Sentiments
Bearish
Bullish
ProTips
Tips that distill complex financial data into concise, actionable investment insights.
Net income is expected to grow this year
- Chewy Inc receives Investment Bank Analyst Rating Update
- Investing.com
Pro
- Chewy Inc receives Investment Bank Analyst Rating Update
- Investing.com
Pro - Chewy Inc receives Investment Bank Analyst Rating Update
- Investing.com
Pro
Technical Analysis
Summary
Strong Sell
Sell
Neutral
Buy
Strong Buy
Strong Buy
Technical Indicators
Strong Buy
Moving Averages
Strong Buy
Chewy, Inc., together with its subsidiaries, engages in the e-commerce business in the United States. It offers pet food and treats, pet supplies and pet medications, and other pet-health products, as well as pet services. The company serves its customer through its retail websites and mobile applications, including Autoship subscription program. Chewy, Inc. was founded in 2010 and is based in Plantation, Florida.
Chewy Inc SWOT Analysis
Analyst Outlook | Analyst targets range from $47 to $50, reflecting optimism about Chewy's long-term prospects despite near-term hurdles in the pet retail landscape |
Market Challenges | Delve into the economic headwinds and competitive pressures facing Chewy, including margin concerns and customer retention challenges |
Growth Catalysts | Discover Chewy's strategic initiatives, including Autoship, health services expansion, and advertising growth, driving revenue and market share |
Pet Retail Dominance | Explore Chewy's ascent as a leading online pet retailer, boasting over 20 million customers and a vast product range from 3,500+ brands |
Chewy Inc Earnings Call Summary for Q4/2026
- Chewy Q4 EPS of $0.27 beat forecast of $0.09 by 200%; revenue met expectations at $3.26B, up 8.1% YoY; stock surged 10.15% in pre-market.
- Autoship subscription model drove 84% of Q4 net sales; gross margin expanded to 29.4%; free cash flow reached record $232M.
- Company projects FY 2027 revenue of $13.58B; upcoming quarters EPS forecast ranges from $0.37 to $0.42.
- Strategic focus on AI integration and Chewy Vet Care platform expansion to enhance operational efficiency and customer engagement.
- Key risks include market saturation in competitive pet industry, macroeconomic pressures on consumer spending, and potential supply chain disruptions.
Last Updated: 03/25/2026, 09:17 AM
Read Full TranscriptChewy investor slides for Q4/2026
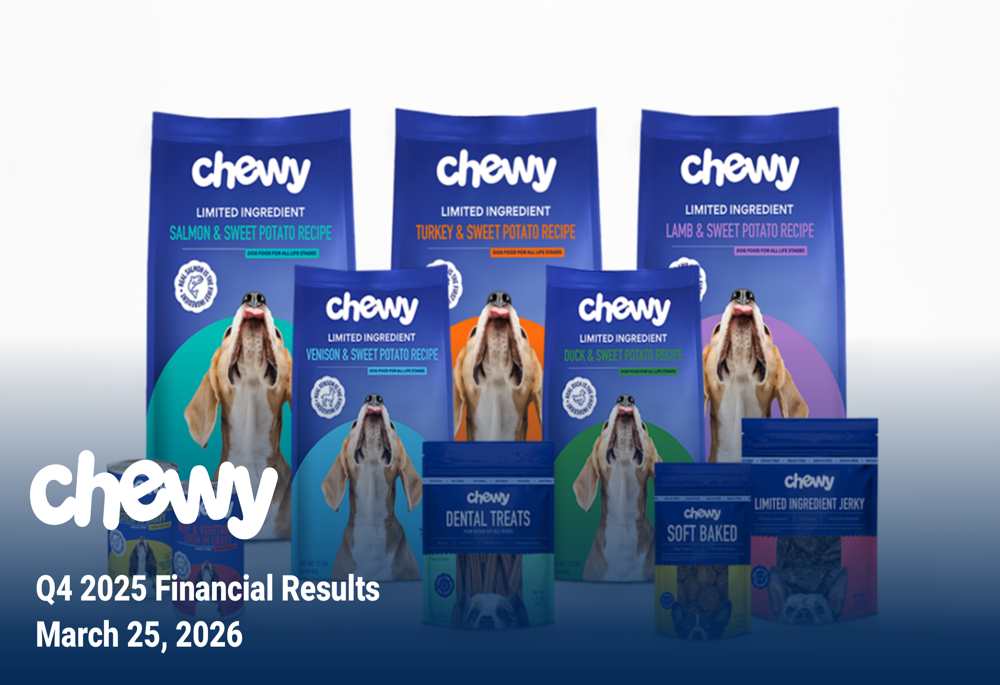
Last Update: Mar 25, 2026
See full investor slides
Compare CHWY to Peers and Sector
Metrics to compare | CHWY | Sector Sector - Average of metrics from a broad group of related Consumer Cyclicals sector companies | Relationship RelationshipCHWYPeersSector | |
|---|---|---|---|---|
P/E Ratio | 48.4x | 27.5x | 10.8x | |
PEG Ratio | −1.13 | 0.34 | 0.02 | |
Price / Book | 21.7x | 2.3x | 1.4x | |
Price / LTM Sales | 0.9x | 1.0x | 0.9x | |
Upside (Analyst Target) | 54.5% | 40.2% | 28.7% | |
Fair Value Upside | Unlock | 8.3% | 10.8% | Unlock |
Analyst Ratings
21 Buy
6 Hold
0 Sell
Ratings:
27 analysts
Overall Consensus
Buy
Analysts 12-Month Price Target:
Average 40.81
(+50.20% Upside)
Earnings
Latest Release
Mar 25, 2026
EPS / Forecast
0.27 / 0.09
Revenue / Forecast
3.26B / 3.26B
People Also Watch
FAQ
What Is the Chewy (CHWY) Stock Price Today?
The Chewy stock price today is 27.17 USD.
What Stock Exchange Does Chewy Trade On?
Chewy is listed and trades on the New York Stock Exchange.
What Is the Stock Symbol for Chewy?
The stock symbol for Chewy is "CHWY."
What Is the Chewy Market Cap?
As of today, Chewy market cap is 11.34B USD.
What Is Chewy's Earnings Per Share (TTM)?
The Chewy EPS (TTM) is 0.52.
When Is the Next Chewy Earnings Date?
Chewy will release its next earnings report on Jun 03, 2026.
From a Technical Analysis Perspective, Is CHWY a Buy or Sell?
Based on moving averages and other technical indicators, the daily buy/sell signal is Strong Buy.
How Many Times Has Chewy Stock Split?
Chewy has split 0 times.
How Many Employees Does Chewy Have?
Chewy has 18000 employees.
What is the current trading status of Chewy (CHWY)?
As of Apr 15, 2026, Chewy (CHWY) is trading at a price of 27.17 USD, with a previous close of 25.89 USD. The stock has fluctuated within a day range of 26.38 USD to 27.24 USD, while its 52-week range spans from 22.74 USD to 48.62 USD.
What Is Chewy (CHWY) Price Target According to Analysts?
The average 12-month price target for Chewy is 40.81 USD, with a high estimate of 50 USD and a low estimate of 28 USD. 21 analysts recommend buying the stock, while 0 suggest selling, leading to an overall rating of Buy. The stock has an +50.20% Upside potential.
What Is the CHWY Premarket Price?
CHWY's last pre-market stock price is 26.22 USD. The pre-market share volume is 14,600.00, and the stock has decreased by 0.33, or 1.27%.
What Is the CHWY After Hours Price?
CHWY's last after hours stock price is 27.22 USD, the stock has decreased by 0.05, or 0.18%.
Install Our App
Risk Disclosure: Trading in financial instruments and/or cryptocurrencies involves high risks including the risk of losing some, or all, of your investment amount, and may not be suitable for all investors. Prices of cryptocurrencies are extremely volatile and may be affected by external factors such as financial, regulatory or political events. Trading on margin increases the financial risks.
Before deciding to trade in financial instrument or cryptocurrencies you should be fully informed of the risks and costs associated with trading the financial markets, carefully consider your investment objectives, level of experience, and risk appetite, and seek professional advice where needed.
Fusion Media would like to remind you that the data contained in this website is not necessarily real-time nor accurate. The data and prices on the website are not necessarily provided by any market or exchange, but may be provided by market makers, and so prices may not be accurate and may differ from the actual price at any given market, meaning prices are indicative and not appropriate for trading purposes. Fusion Media and any provider of the data contained in this website will not accept liability for any loss or damage as a result of your trading, or your reliance on the information contained within this website.
It is prohibited to use, store, reproduce, display, modify, transmit or distribute the data contained in this website without the explicit prior written permission of Fusion Media and/or the data provider. All intellectual property rights are reserved by the providers and/or the exchange providing the data contained in this website.
Fusion Media may be compensated by the advertisers that appear on the website, based on your interaction with the advertisements or advertisers.
© 2007-2026 - Fusion Media Limited. All Rights Reserved.